

According to ATTOM Data Solutions’ newly released Home Flipping Report, there were 59,876 U.S. single family homes and condos flipped during the second quarter of 2019. That number is up 12.4 percent from Q1 2019, but down 5.2 percent from Q2 2018.
The report revealed that homes flipped in Q2 2019 represented 5.9 percent of all home sales during the quarter. That number is down from a post-recession high of 7.2 percent in Q1 2019, but up from 5.4 percent in Q2 2018.
Also noted in the report, homes flipped in the second quarter of 2019 generated a gross profit of $62,700 (which is the difference between the median sales price and median paid by investors). That number is up 2 percent from Q1 2019, but down 2 percent from Q2 2018.
On a national level, the gross flipping profit of $62,700 in Q2 2019 translated into a 39.9 percent ROI compared to the original acquisition price. That number is down from a 40.9 percent gross flipping ROI in Q1 2019 and from a margin of 44.4 percent in Q2 2018. Returns on home flips have dropped six quarters in a row and eight of the last 10, now standing at the lowest level since Q4 2011.
The report states that among the 149 metro areas analyzed in the report with at least 50 home flips in Q2 2019, five had gross ROI flipping profits of more than 100 percent: Scranton, PA (134 percent); Pittsburgh, PA (132.5 percent); Reading, PA (129.3 percent); Kingsport, TN (104.1 percent) and Augusta, GA (101.1 percent).
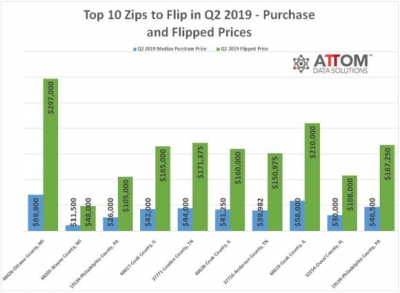
On the zip code level, the top 10 zips to flip in Q2 2019 based on gross ROI, with at least 10 more flips during the quarter, included 49426-Ottawa County, MI (324.9 percent); 48205-Wayne County, MI (317.4 percent); 19134-Philadelphia County, PA (303.8 percent); 60617-Cook County, IL (292.9 percent); 37771-Loudon County, TN (289.5 percent); 60628-Cook County, IL (287.9 percent); 37716-Anderson County, TN (277.6 percent); 60619-Cook County, IL (262.1 percent); 32254-Duval County, FL (260.0 percent); and 19139-Philadelphia County, PA (259.7 percent).
The Q2 2019 gross flipping profit for these top 10 zips were as follows: 49426-Ottawa County, MI ($227,100); 48205-Wayne County, MI ($36,500); 19134-Philadelphia County, PA ($79,000); 60617-Cook County, IL ($123,000); 37771-Loudon County, TN ($127,375); 60628-Cook County, IL ($118,750); 37716-Anderson County, TN ($110,993); 60619-Cook County, IL ($152,000); 32254-Duval County, FL ($78,000); and 19139-Philadelphia County, PA ($120,750).
Source: ATTOM Data Solutions
What Happened to Rates Last Week?

Mortgage backed securities (FNMA 3.000 MBS) gained +42 basis points (BPS) from last Friday’s close which caused fixed mortgage rates to move lower compared to the prior week.
Overview: Mortgage rates moved lower after the one-two punch of weaker than expected manufacturing and services data which raised expectations for the potential of two more rate cuts by the Federal Reserve this year. We had a very solid jobs report on Friday with a new 50 year low for Unemployment (3.5%).
Services: The National ISM Services PMI was weaker than expected (52.6 vs est of 55.0). While any reading above 50 is still expansionary (meaning that the services sector which accounts for 85% of our economic output, grew last month) it is the slowest rate of growth since 2016.
Manufacturing: The September National ISM Manufacturing PMI hit 47.8 vs est of 50.1 which is the lowest (worse) level since 2009. Prices Paid hit 49.7 vs est of 45.5.
Jobs, Jobs, Jobs: We got the Big Jobs report on Friday. You can read the official BLS release here.
Here is the tale of the tape:
Jobs:
September Non-Farm Payrolls (NFP) increased by 136K vs expectations in the 140K to 145K range.
August NFP was revised upward from 130K to 168K
July NFP was revised upward from 159K to 166K
The more closely watched rolling three month average is 157K which is very attractive.
Wages:
The Average Hourly Earnings are $28.09
The MOM change is 0.0% vs. market expectations of 0.3%
The YOY change is 2.9% which is lower than the recent trend of 3.2%
Unemployment:
The headline Unemployment Rate dropped to 3.5%, the lowest in 50 years. The market was expecting it to remain at 3.7%.
The U6 Unemployment Rate dropped to 6.9% in a very rare appears below the 7.0% mark. The last month was at 7.2%
The Participation Rate remained at 63.2%
The Talking Fed: Fed Chair Powell spoke on Friday. You can read his prepared statement here.
Here are a few key sentences from the speech:
- “Unemployment is near a half-century low, and inflation is running close to, but a bit below, our 2% objective,” Powell says without directly addressing Friday’s jobs report.
- “While we believe our strategy and tools have been and remain effective, the U.S. economy, like other advanced economies around the world, is facing some longer-term challenges — from low growth, low inflation, and low interest rates”.
- “Low can be good, but when inflation — and, consequently, interest rates—are too low, the Fed and other central banks have less room to cut rates to support the economy during downturns”.
What to Watch Out For This Week:

The above are the major economic reports that will hit the market this week. They each have the ability to affect the pricing of Mortgage Backed Securities and therefore, interest rates for Government and Conventional mortgages. I will be watching these reports closely for you and let you know if there are any big surprises.
It is virtually impossible for you to keep track of what is going on with the economy and other events that can impact the housing and mortgage markets. Just leave it to me, I monitor the live trading of Mortgage Backed Securities which are the only thing government and conventional mortgage rates are based upon.